
Looking back
on 2023-24
Annual report for B3Living customers

This report is for you.
It’s here to help our customers see how we’re performing.
As well as this, we want to share how we’ve taken your views into account to improve our services.
We’ve tried to be as transparent as possible, so this report contains lots of numbers.
But if anything isn’t clear, please let us know at communications@b3living.org.uk.


Overall, how
did things go?
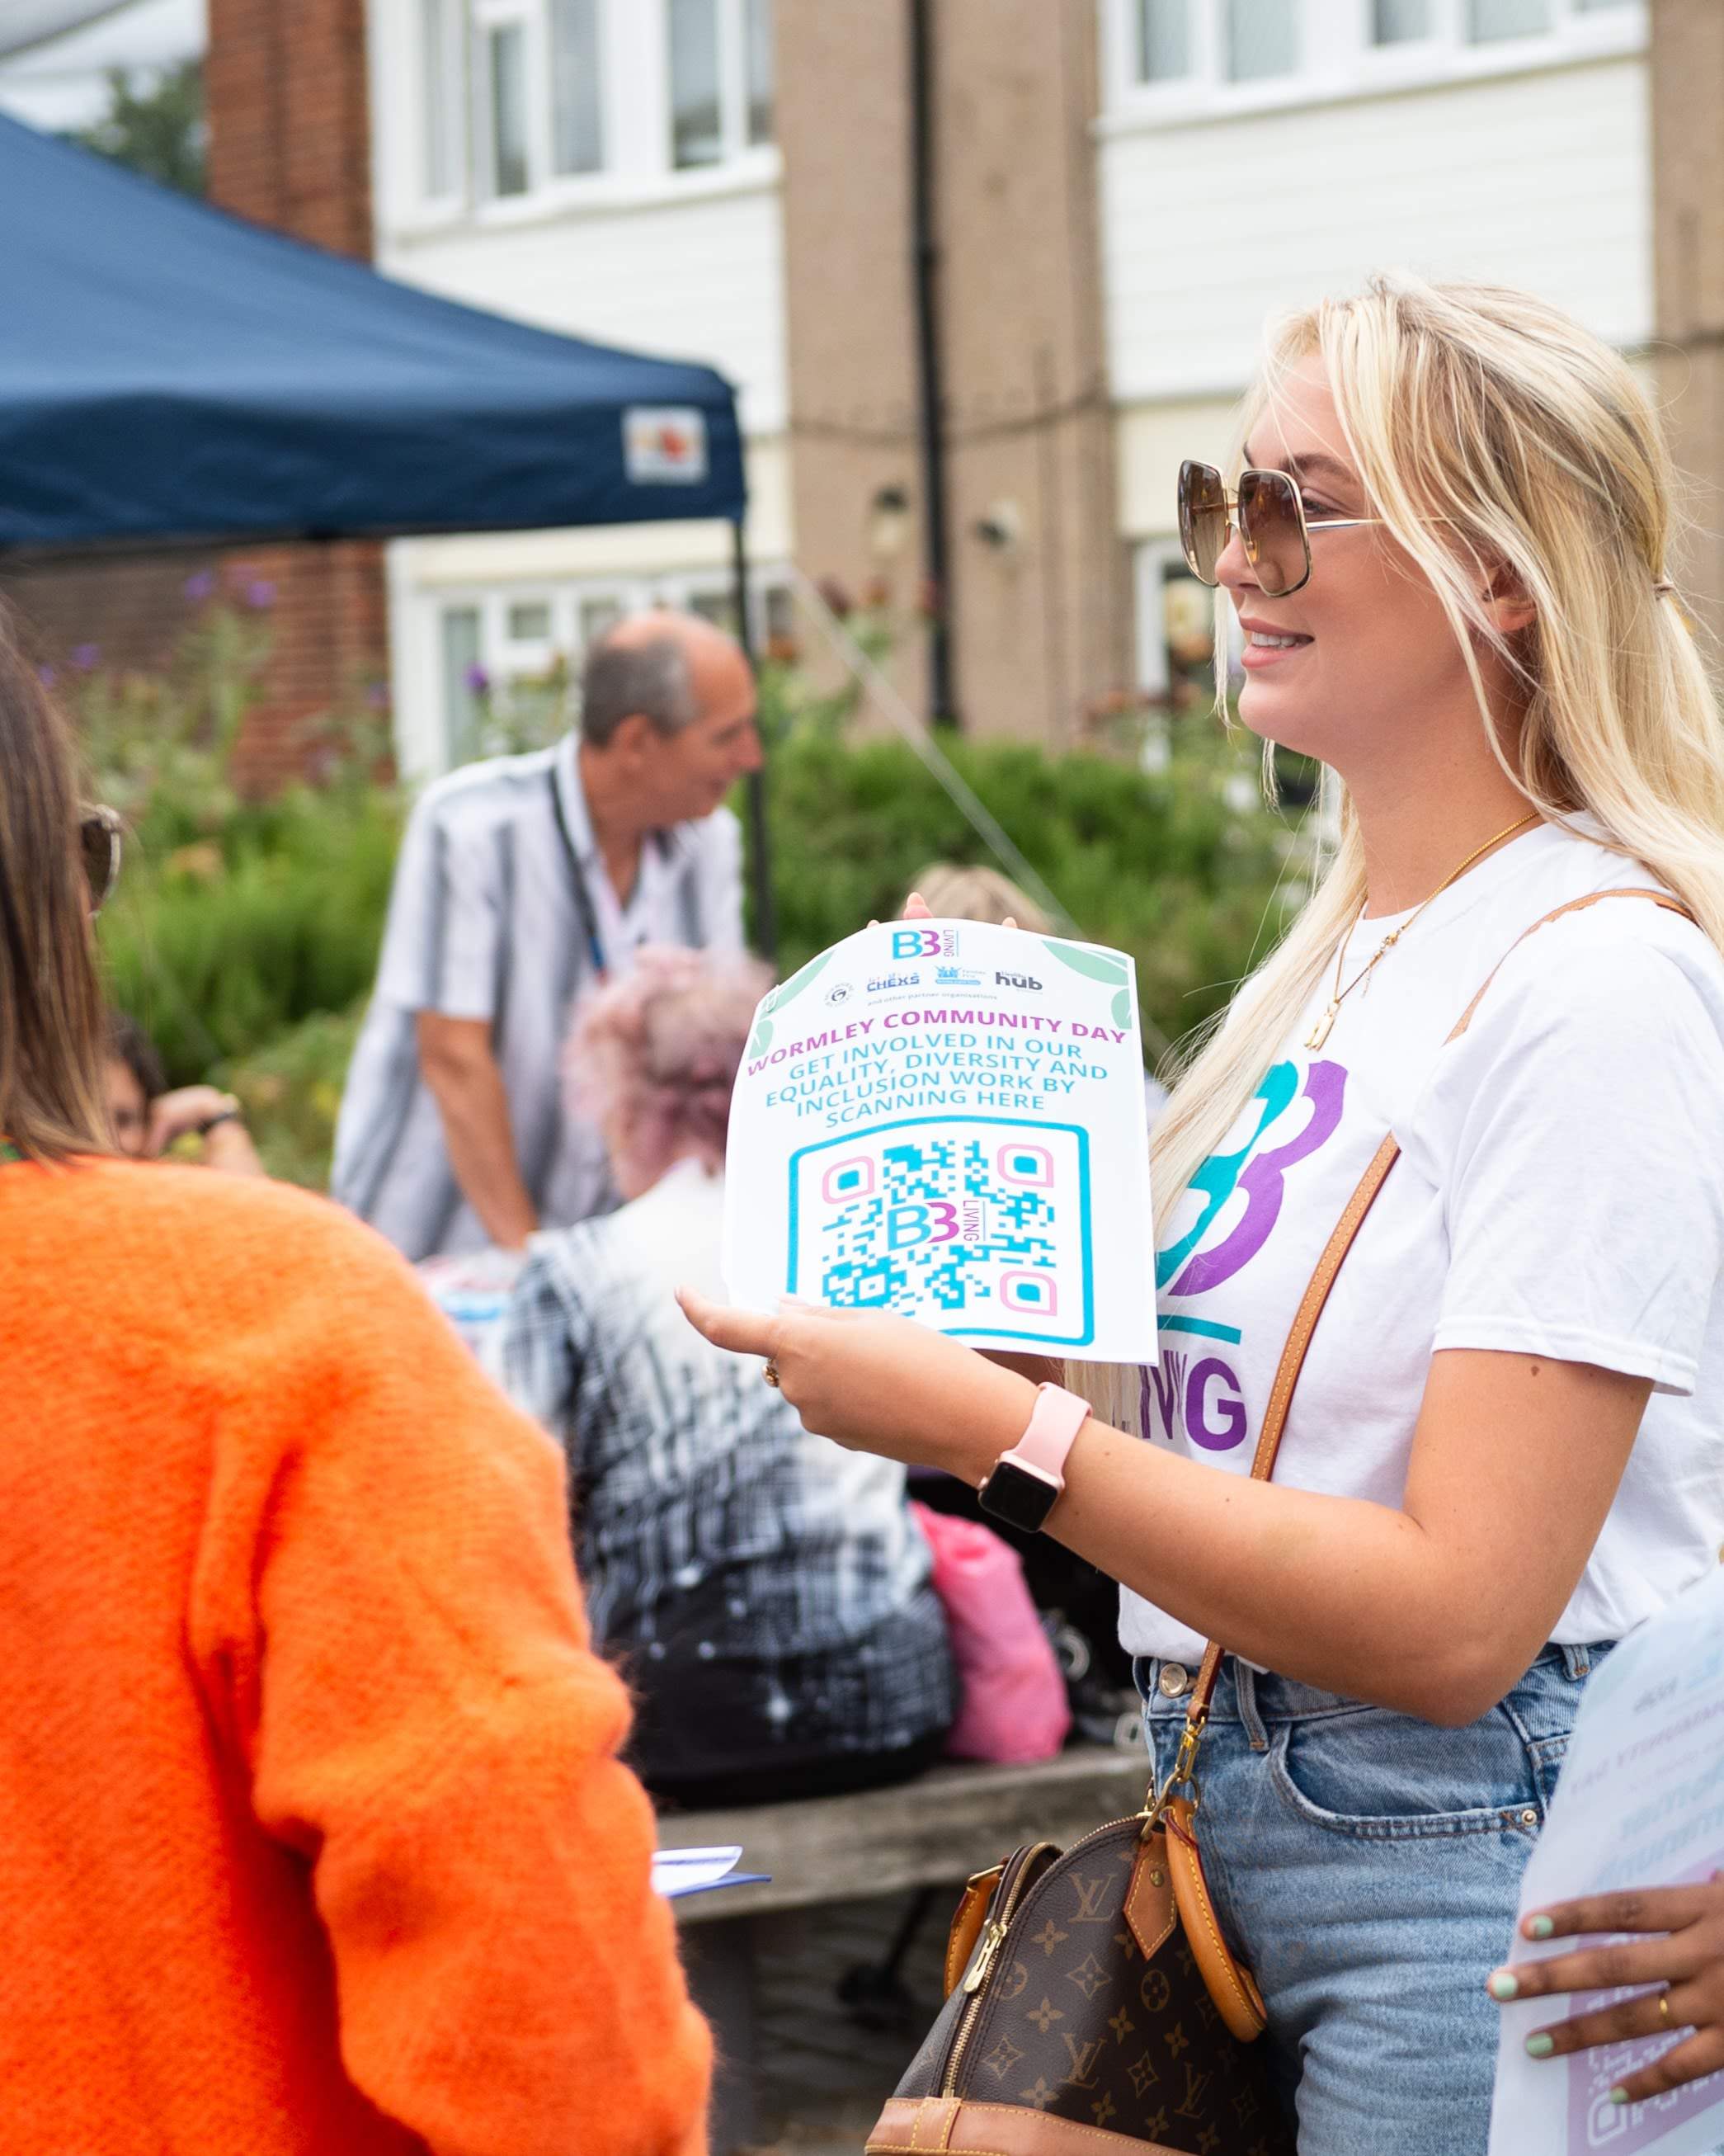
Thank you to all the customers who gave us
feedback this year.
Whether this was through a telephone
survey, joining a focus group, making
a complaint, responding to a poll or
just sharing your thoughts with our team.
84.6%
overall customer
satisfaction
This score is staying
pretty steady.
Although it’s dropped a little, this seems to
match trends we’re seeing across other
landlords as well as customer service
businesses in the UK more widely.
It’s good to hear that broadly you’re
happy with the way we work overall.
But 84.6% means there’s room to improve.
Read on to find out what we’ve learned
from your comments and how this is
changing the way we run services for you.
Listening and learning
We gather lots of information from you through surveys, complaints, and more.
But it's key that we convert those insights into changes.
Changes in the way we work, how our services run and, ultimately, the experience you have as a customer.
Here are some examples from 2023-24:

Dedicated complaints team
As you'll read later, we responded to 82% of complaints on time. But we want this figure to be 95% or higher. So, we brought in 2 x dedicated Resolution Leads to focus exclusively on your complaints. They started at the end of 2023-24.
They'll spend more time diagnosing the issues that cause complaints, investigating what happened and communicating with you more frequently. For example, people with long-running cases often felt left out of the loop. So the Resolution Leads will now check in with ongoing cases approx. every two weeks.
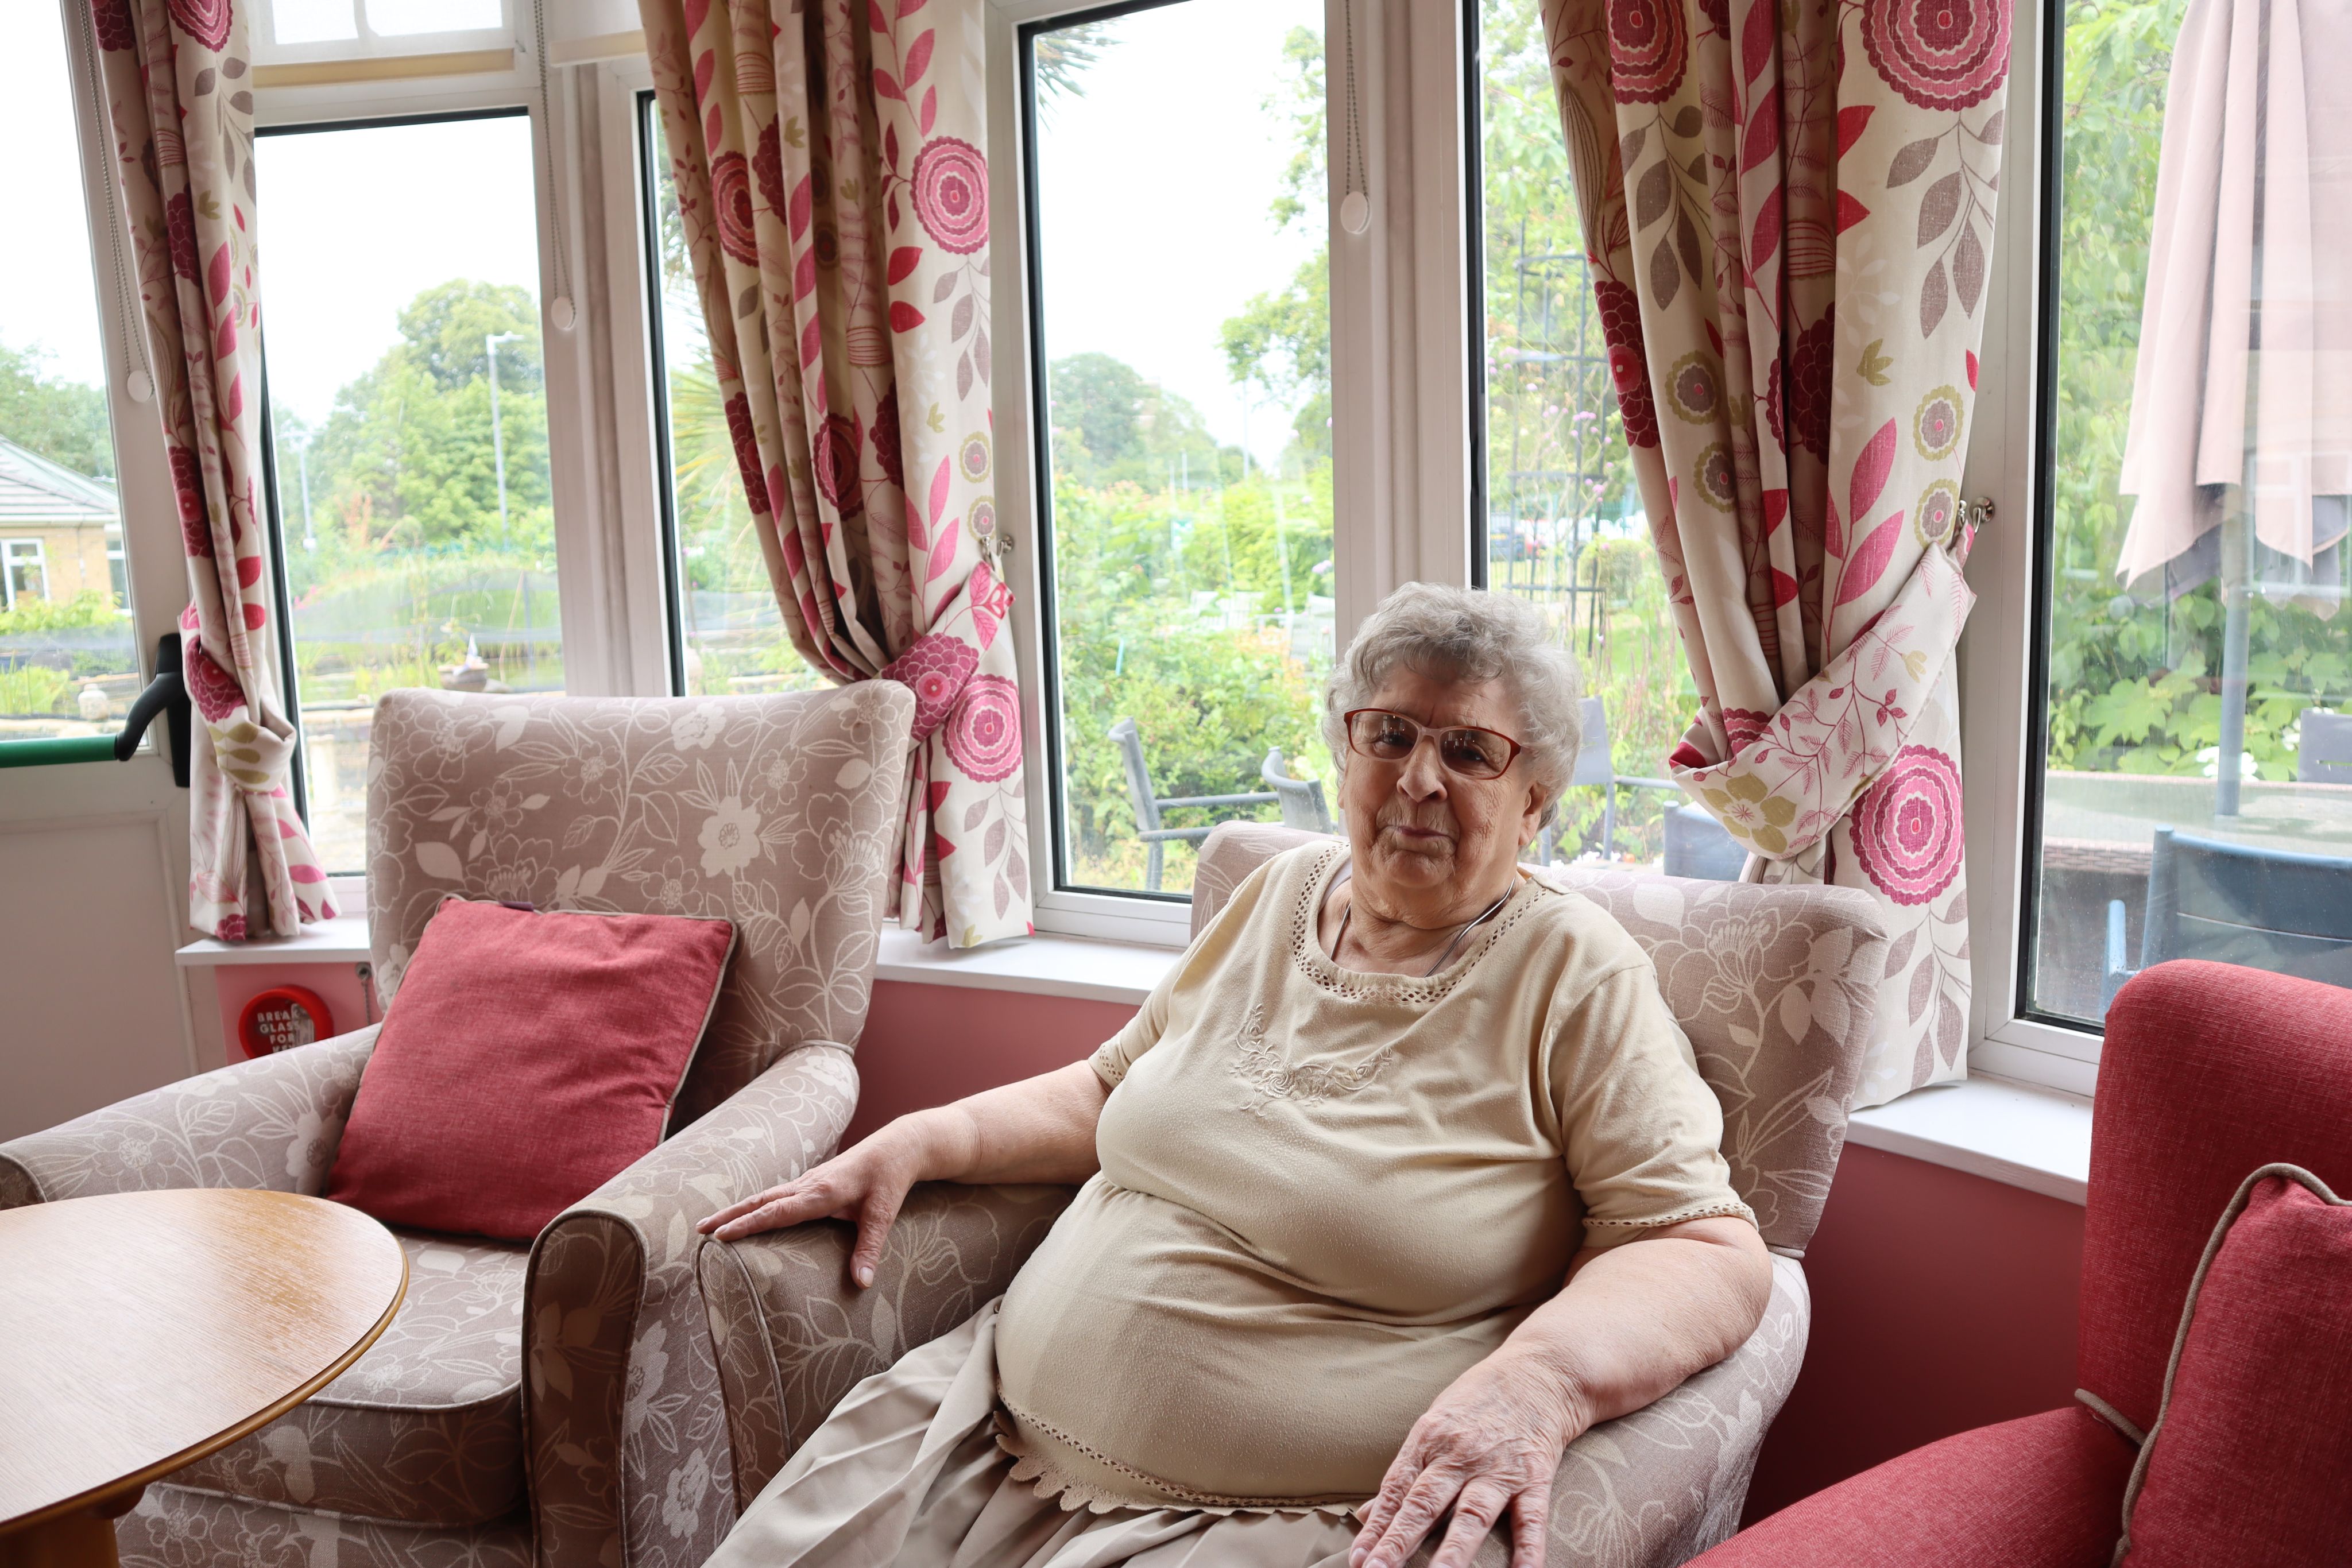
Independent Living service rotas
This team find it helpful to rotate regularly to share knowledge and be resilient. However, customers in our Independent Living schemes told us they'd appreciate more consistency in who they deal with. So, the team have extended their rotation period to three months so they can finish off any work with customers.

Communal heating charges
Following feedback from complaints, we know we need to do more to prepare customers for changes in their energy bills if they get communal services. We might not be able to stop prices going up, but in future we'll communicate any change earlier.

Contractor behaviours
We've been doing a lot of work with our contractors to:
- Make sure they ask whether they can keep their shoes on it your home.
- Get them to double check names/addresses before trying to book appointments.
- Make them aware of new build homes, to avoid confusion when new customers book repairs.
- Raise awareness about how best to work with customers who have vulnerabilities.
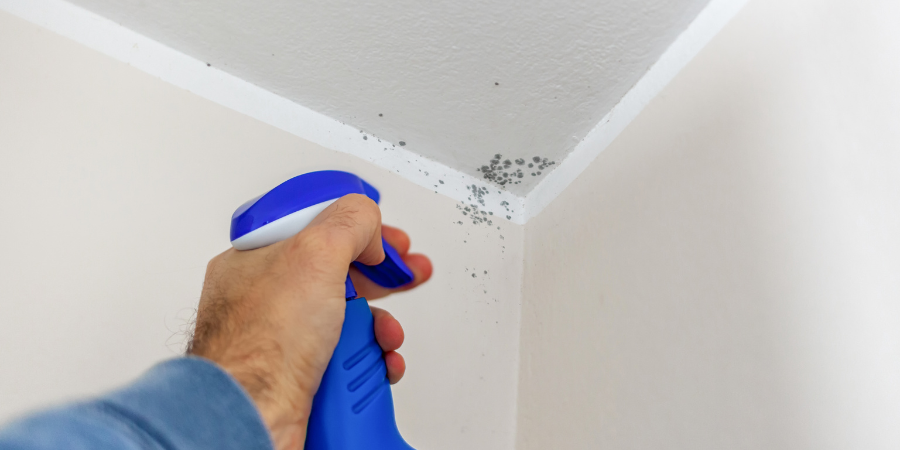
Damp and
mould
We've undertaken a big project to review our damp and mould processes. We used feedback from complaints, survey data as well as focus groups.
There are lot more changes to come, but so far we have:
- Built a new tracking system to better handle live cases.
- Set up regular meetings with our specialist, the Dwelling Doctor, to check in on cases.
- Designed a new suite of communications - ready for 2024-25.

Defects in new build homes
Although customers who move into our newly built homes give very positive feedback, a couple of complaints highlighted that they couldn't get defects sorted as quickly as we'd want.
So we've allocated a designated member of our Development team to log and monitor these to give a better level of service.
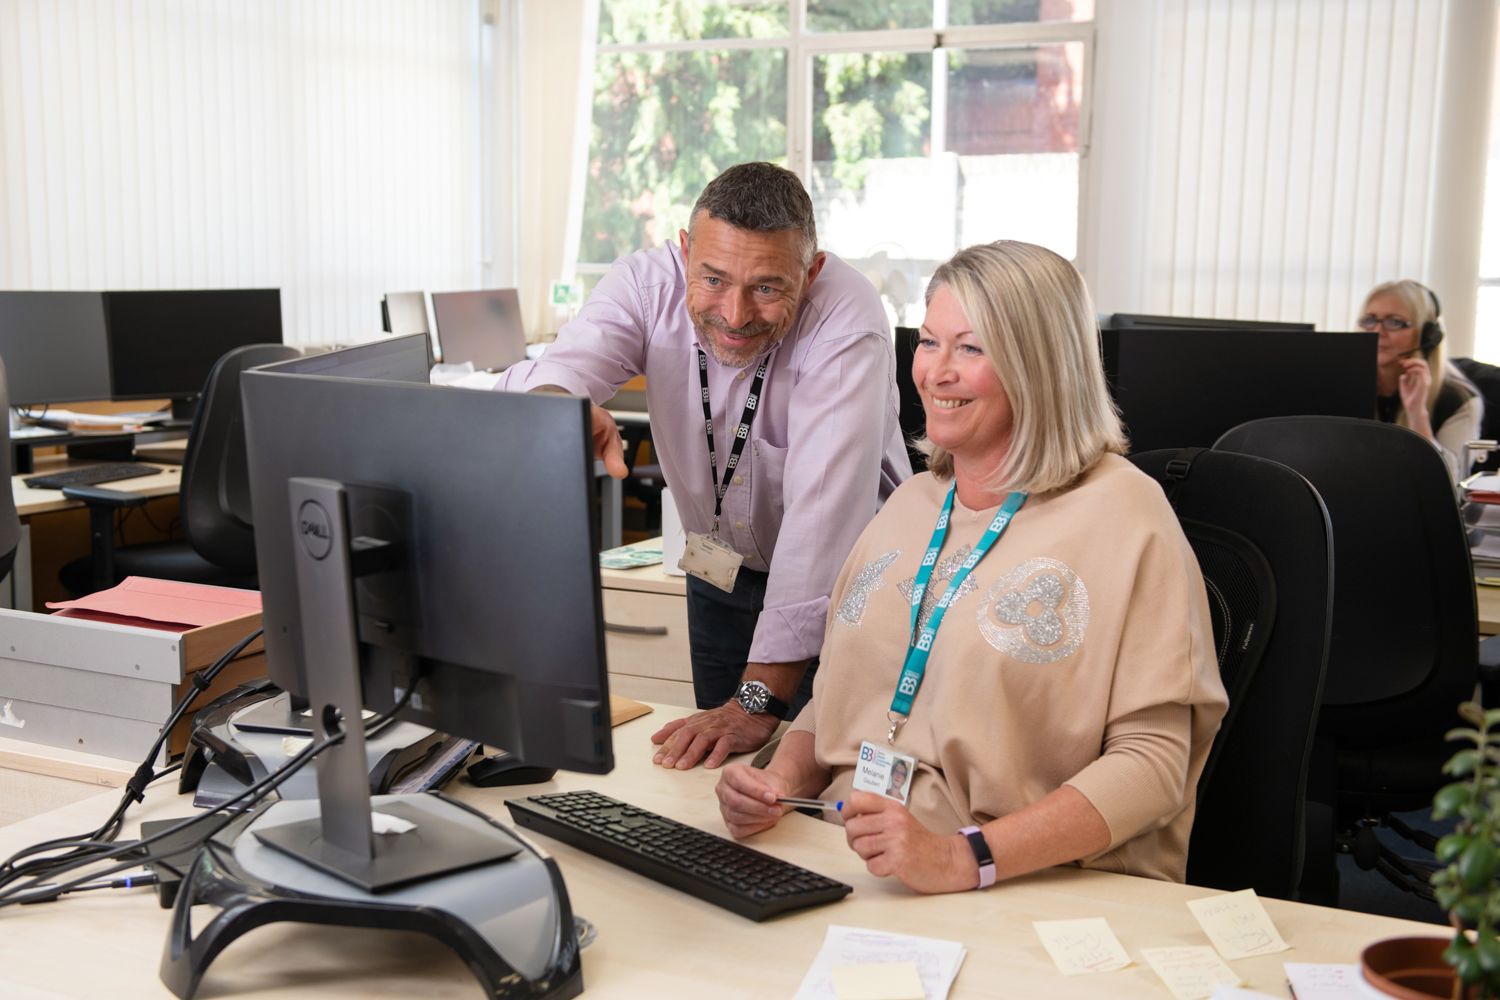
Contact with our Property teams
Our surveys and complaints showed that we could tighten up on a few areas to give you a better customer when you contact our Property Services department (i.e. repairs, refurbishments, damp/mould, adaptation, etc)
We've looked at:
- Making sure colleagues give you their name.
- Communicating with neighbours when big works are happening - e.g. on roofs. This includes private homeowners.
- Sharing more information on how scaffolding will impact you before it goes up.
Looking at your feedback from 2023-24, next year we will be...
- Changing how we run our grass cutting contract.
- Reviewing our processes for dealing with anti-social behaviour.
- Looking at our service standards so we can give you a better idea around things like when we should be getting back to you, etc.


What are the Tenant Satisfaction Measures (TSMs)?
Throughout this report, you’ll see figures labelled “Tenant Satisfaction Measures”, or TSMs for short. These are new. Our regulator set them up to help you see how well our services are doing.

They’re a set of 22 different scores. They measure lots of things – from how quickly we do repairs through to whether we treat you with respect.
How do we calculate them?
It varies from figure to figure. Sometimes they’re based on things we can check in our systems; sometimes it’s based on your feedback:
- If the score is about how satisfied you are, then this score came from a telephone survey to more than 500 customers. This was run by a third party called IFF – to make sure those of you who responded could be as honest as possible.
- Other scores will be based on information we log in our databases. The calculations have been set out by our regulator to make sure all landlords work them out the same way.
The TSMs are here to help you compare us to others – but landlords can be very different sizes. So, you’ll see some figures broken down per home or per 1,000 homes.


We’ve published lots more details on our website about the method behind our TSMs – please visit https://www.b3living.org.uk/tsm
Our full set of TSMs is also available at the end of this report.
Looking closer
Overall satisfaction is just one way to measure how we’re doing. We also have a bigger set of customer service standards.
Our service standards are set of promises about the way we will work with you. The following section shows how well met our standards.


Keeping properties in good repair
Our service standards say we’ll:
· Work to help you feel and be safe in your home.
We do this for by…
- Make sure all our homes meet the Government’s ‘Decent Homes Standard’.
- Offering a range of ways for you to report a repair.
- Getting out to all emergency repairs within 24 hours.
- Arranging appointments at times that suit us both if we need to go inside your home.
- Aiming to fix your repair on the first attempt.
- Maintaining homes and shared areas on a planned cycle.
How we did…
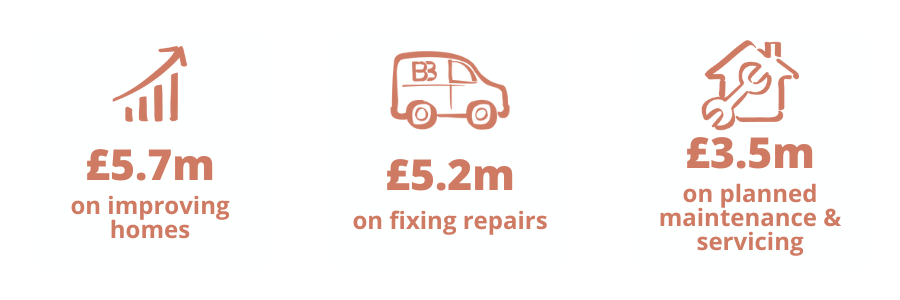
We spent…


|
84.9% |
customers satisfied with our overall repairs service |
|---|---|
|
83.9% |
of these customers who felt satisfied that how long their most recent repair took. |
|
82.4% |
customers satisfied that their home is well maintained. |
|
0.6% |
homes don’t meet the Decent Homes Standard. |
|---|---|
|
84.1% |
routine repairs completed on time. |
|
97.4% |
emergency repairs completed on time. |

Effective handling of complaints
Our service standards say we’ll:
- Respond quickly and efficiently to complaints.
- Make sure that we put things right where we have made mistakes.
- Learn from customer feedback as an organisation.
We do this for by…
- Making it easy for you to tell us when we’ve done a good job and when something’s gone wrong.
- Apologising when we’ve got it wrong and explaining how we will put things right.
- Providing a clear and accessible complaints procedure.
- Making sure you know what the next steps are if you’re still unhappy after we respond to your complaint.
How we did…
Complaints and the Ombudsman
Key drivers behind our complaints this year included: issues with our grass cutting service, how we deliver routine repairs, and how we communicate changes in service charges.
This year we have put a lot of focus into tightening up our complaints process and to learn lessons from them - there are more details about this earlier in the report (click here).
As part of this, and our obligations to our regulator / the Housing Ombudsman, we've published a dedicated report on complaints. This breaks down the thmes, trends and outcomes of our complaints in more detail.

|
68.2 |
Stage 1 complaint cases opened |
|---|---|
|
82.1% |
Stage 1 complaints responded to on time. |
|
7.8 |
Stage 2 complaint cases opened |
|---|---|
|
62.5% |
Stage 2 complaints responded to on time. |
|
49.0% |
customers satisfied with our approach to complaints handling (of those who made a complaint in the last 12 months). |
|---|


Maintaining building safety
Our service standards say we’ll:
· Work to help you feel and be safe in your home.
We do this for by…
- Make sure all our homes meet the Government’s ‘Decent Homes Standard’.
- Complying with our legal responsibilities as a landlord, including gas, electrical, fire safety, water hygiene and asbestos management and lifting equipment.
How we did…

|
83.2% |
customers satisfied that their home was safe. |
|---|


Respectful and helpful engage-ment
Our service standards say we’ll:
- Empower you by giving you choices when it comes to how you contact us and when/how you use our services.
- Make it easier to access information about your homes.
- Listen to you and design our services to meet your needs.
We do this for by…
- Making sure that all customer information we hold is up to date and accurate.
- Being understanding and helpful and supporting you quickly and efficiently.
- Making sure you get all the information you need to answer your question and by explaining any next steps (if relevant).
- Making sure that our colleagues always display their ID badges and give you their names and job title.
- Involving you in shaping our services - depending on your interests and how much time you can/want to commit.
- Giving you opportunities to talk about our performance or get involved in service reviews.
- Publishing this report (our Customer Annual Review) so you know how we’re doing.
How we did…

|
71.3% |
customers satisfied that we listen to your views and act upon them. |
|---|---|
|
81.1% |
customers satisfied that we keep you informed about things that matter to you. |
|
87.3% |
customers satisfied that we treat you fairly and with respect. |
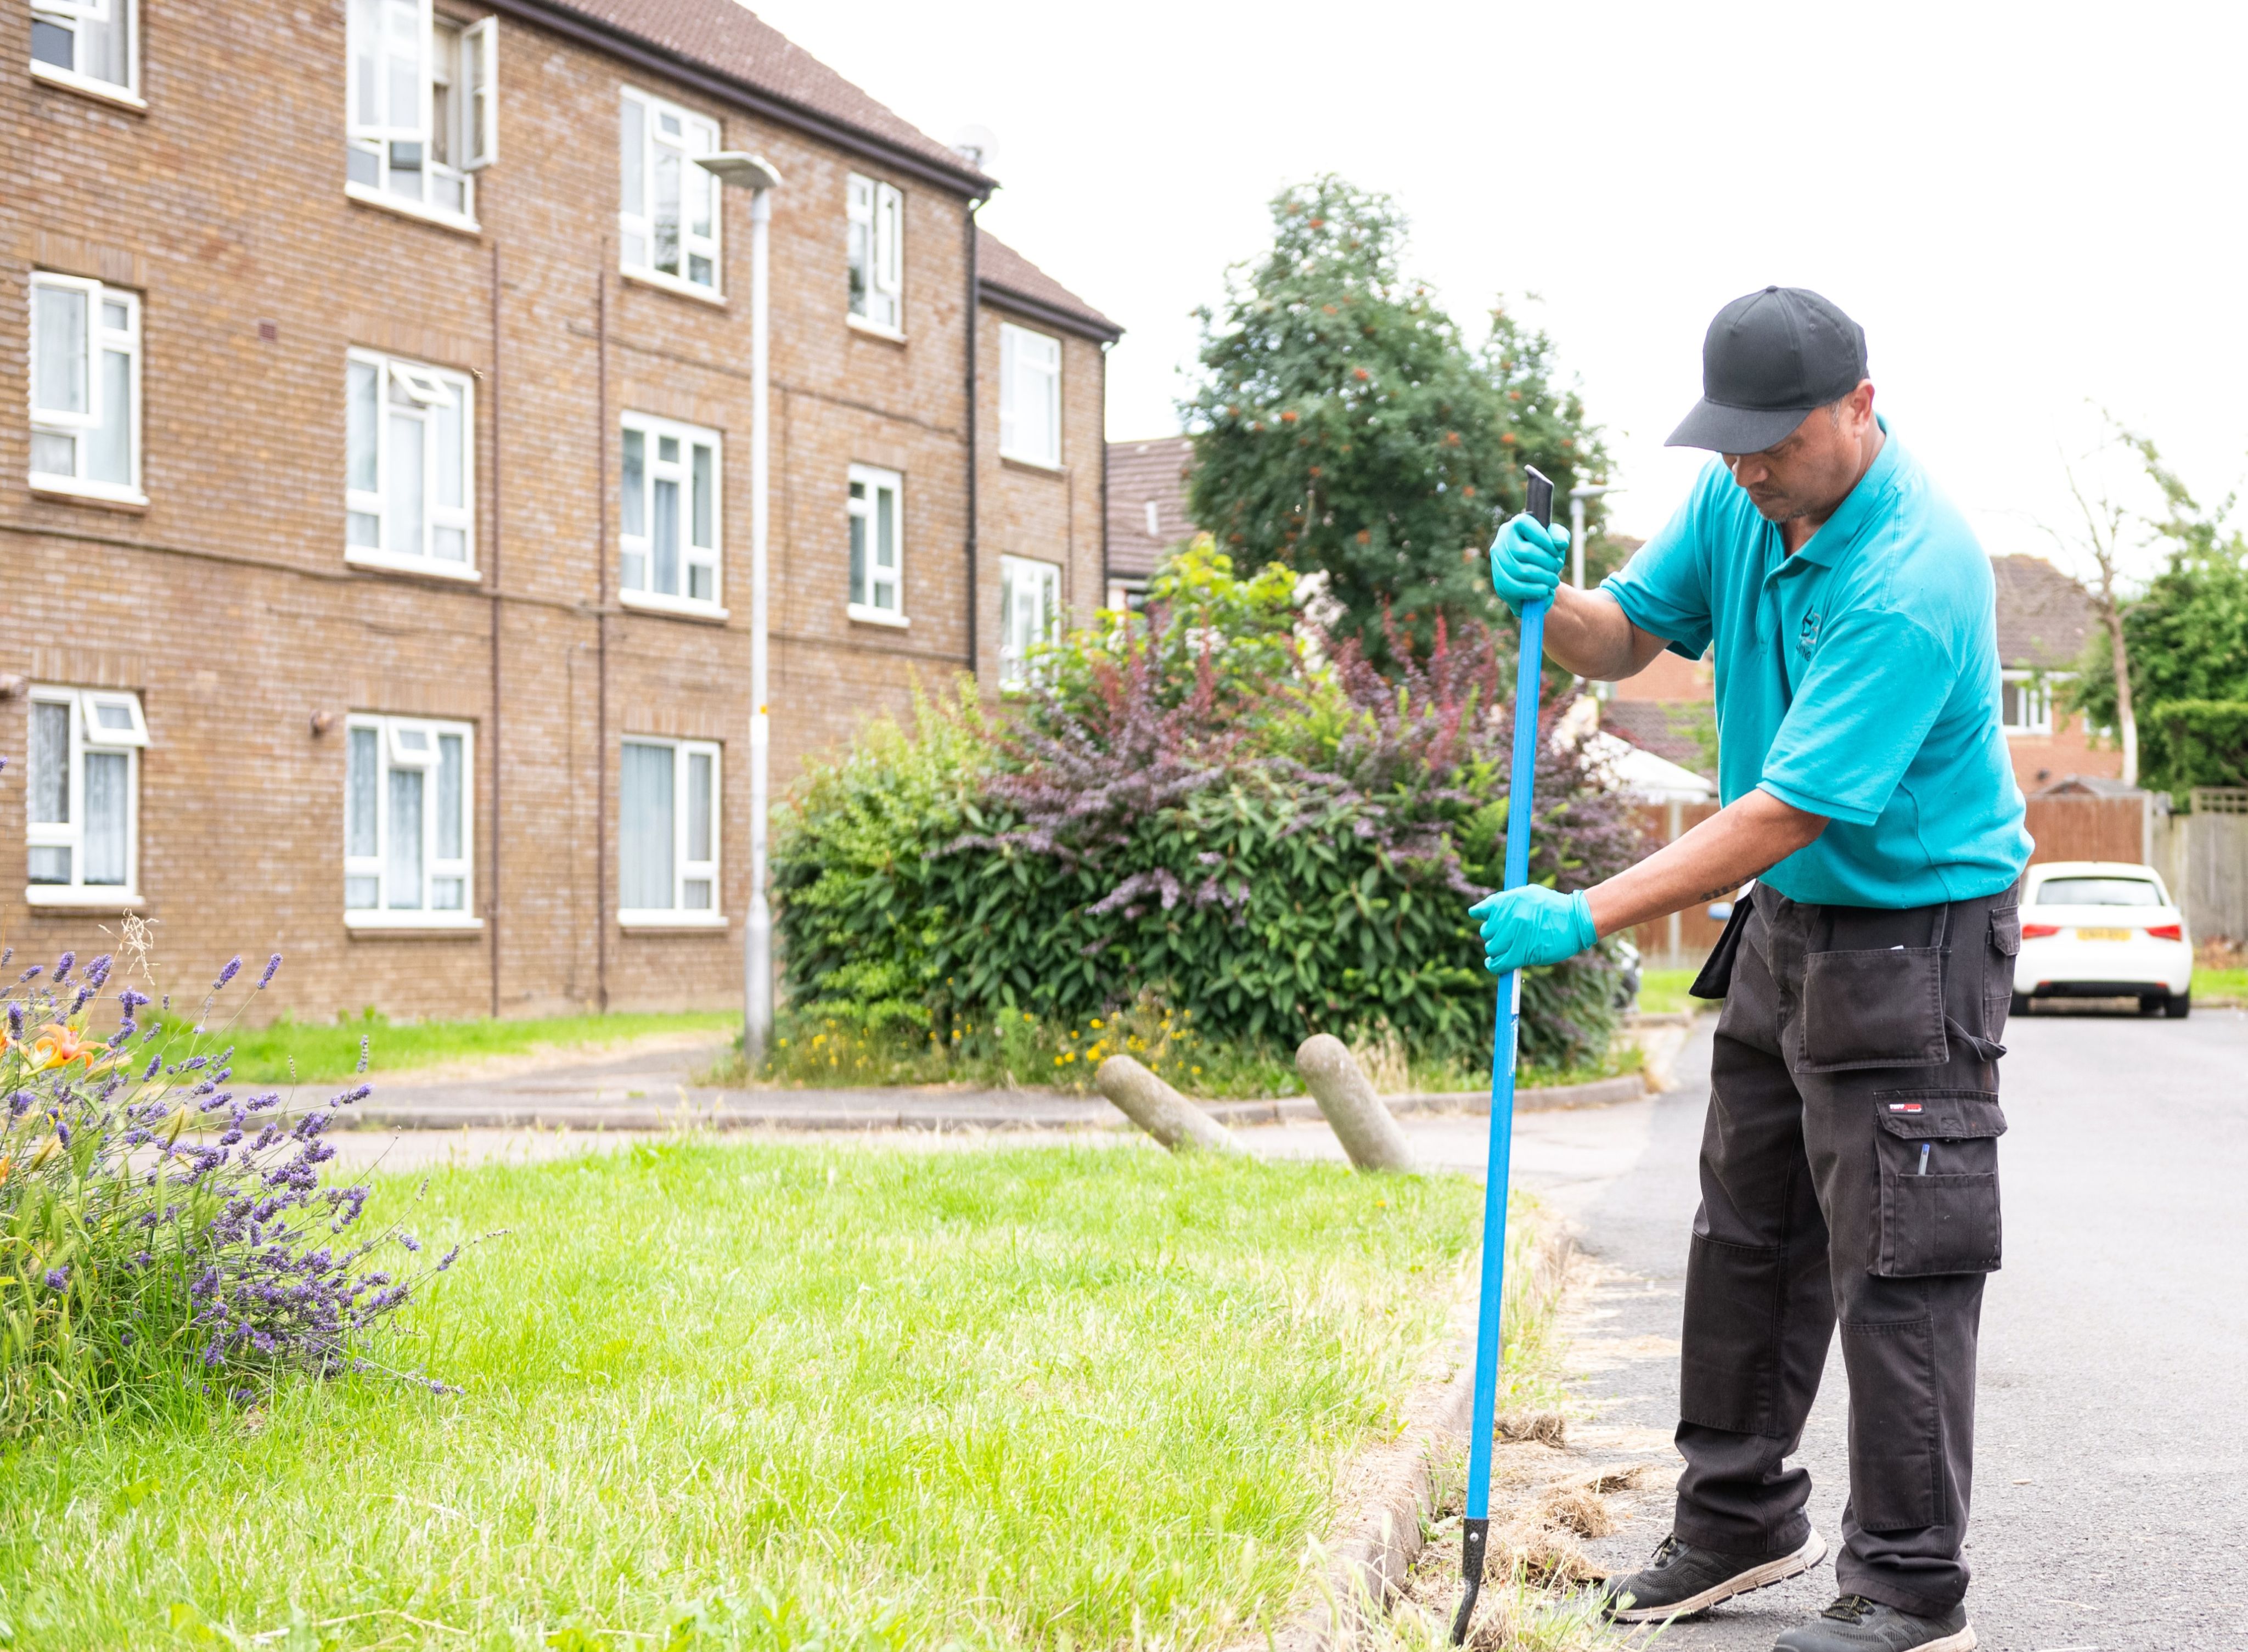
Responsible neighbourhood management
Our service standards say we’ll:
- Put things in place to help neighbourhoods create a sense of community.
We do this for by…
- Providing regular cleaning services for inside and outside shared areas.
- Maintaining communal gardens so they are safe and secure.
- Making it easy to report neighbourhood issues.
- Responding to hate crime, domestic violence or serious physical assault within 24 hours and all other reports of neighbourhood issues within 5 working days.
- Working together - with you and other partners - to make your neighbourhood a better place to live.
How we did…
|
70.9% |
customers satisfied that we keep communal areas clean and well maintained. |
|---|---|
|
73.3% |
customers satisfied that we make a positive contribution to your neighbourhood. |
|
35.7 |
anti-social behaviour cases opened per 1,000 homes. |
|---|---|
|
0.4 |
anti-social behaviour cases that involve hate incidents opened per 1,000 homes. |
|
69.8% |
customers satisfied with our approach to handling anti-social behaviour. |

Value for money
Our service standards say we’ll:
- Have values and a culture that is driven by a responsible core purpose and ethics.
- Ensure our business is inclusive and respects diversity.
We do this for by…
- Communicating with you in a way that best suits your needs.
- Responding effectively and sensitively to your needs.
- Deliver our services in a way that does not discriminate against anyone based on sex, age, race, religion, disability, sexual orientation, gender reassignment, marriage and civil partnership or pregnancy and maternity.
- Treat everyone who uses our service fairly and equally.
- Arrange a home visit at a mutually convenient time if it is difficult for you to visit our office.


How we did…
|
84.3% |
tenants were satisfied we offer value for money for their rent. |
|---|
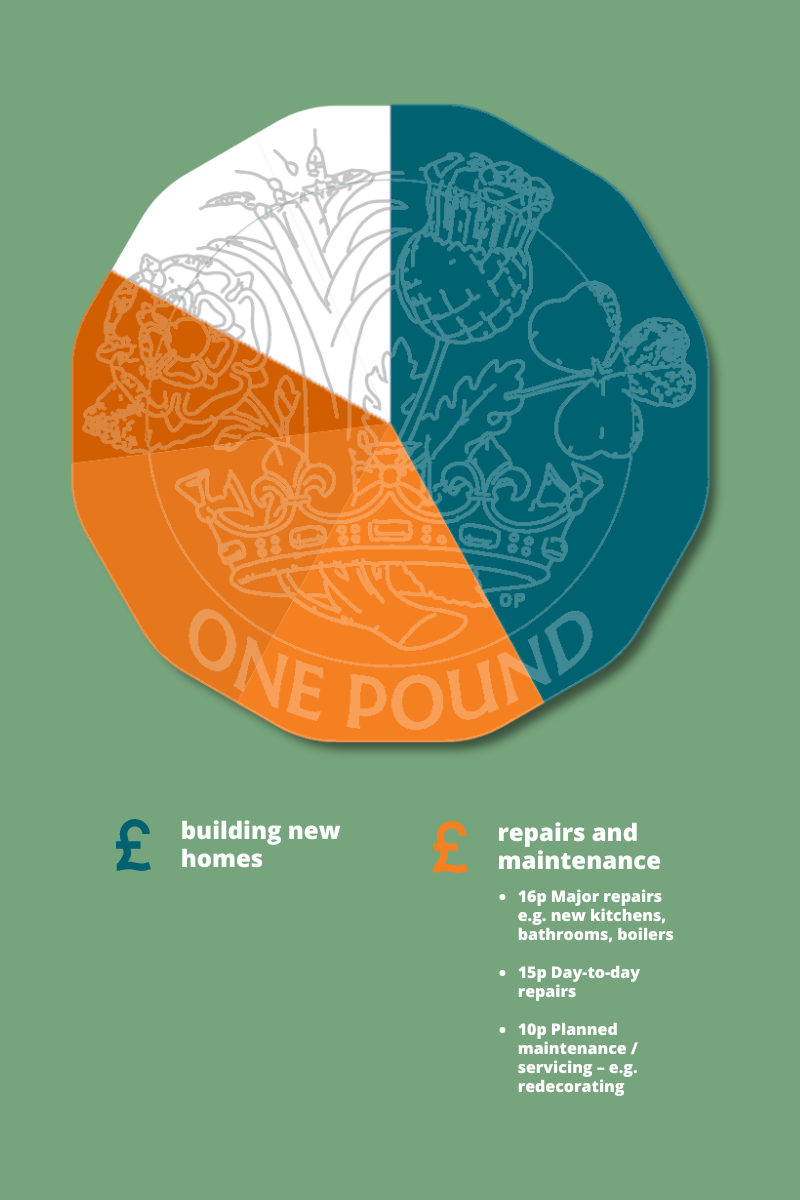
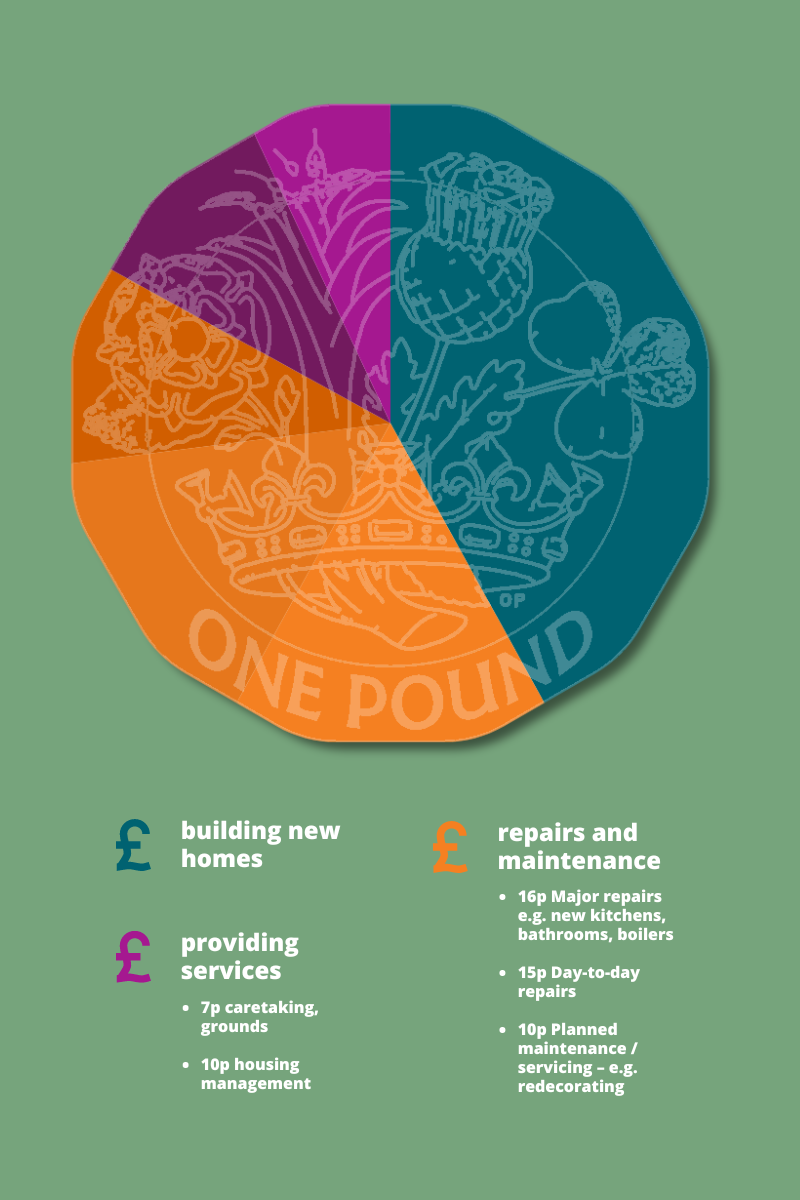
So you can compare us with other landlords, here are some stats on how much it costs to run B3Living.
For every 1 x social home* we own/managed last year…

*We own/manage 5,234 social housing homes.
This figure doesn’t include some of the other homes we manage, such as market rent homes.
Tenant Satisfaction Measures (TSMs)
in full
|
Tenant perception scores (tenants only) |
|
|
TP01 - Proportion of respondents who report that they are satisfied with the overall service from their landlord. |
84.6% |
|
TP02 - Proportion of respondents who have received a repair in the last 12 months who report that they are satisfied with the overall repairs service. |
84.9% |
|
TP03 - Proportion of respondents who have received a repair in the last 12 months who report that they are satisfied with the time taken to complete their most recent repair. |
83.9% |
|
TP04 - Proportion of respondents who report that they are satisfied that their home is well maintained. |
82.4% |
|
TP05 - Proportion of respondents who report that they are satisfied that their home is safe. |
83.2% |
|
TP06 - Proportion of respondents who report that they are satisfied that their landlord listens to tenant views and acts upon them. |
71.3% |
|
TP07 - Proportion of respondents who report that they are satisfied that their landlord keeps them informed about things that matter to them. |
81.1% |
|
TP08 - Proportion of respondents who report that they agree their landlord treats them fairly and with respect. |
87.3% |
|
TP09 - Proportion of respondents who report making a complaint in the last 12 months who are satisfied with their landlord’s approach to complaints handling. |
49.0% |
|
TP10 - Proportion of respondents with communal areas who report that they are satisfied that their landlord keeps communal areas clean and well maintained. |
70.9% |
|
TP11 - Proportion of respondents who report that they are satisfied that their landlord makes a positive contribution to the neighbourhood. |
73.3% |
|
TP12 - Proportion of respondents who report that they are satisfied with their landlord’s approach to handling anti-social behaviour. |
69.8% |
|
Building safety (tenants and shared owners) |
|
|
BS01 - Proportion of homes for which all required gas safety checks have been carried out. |
100.0% |
|
BS02 - Proportion of homes for which all required fire risk assessments have been carried out. |
100.0% |
|
BS03 - Proportion of homes for which all required asbestos management surveys or re-inspections have been carried out. |
98.1% |
|
BS04 - Proportion of homes for which all required legionella risk assessments have been carried out. |
99.7% |
|
BS05 - Proportion of homes for which all required communal passenger lift safety checks have been carried out. |
99.2% |
|
Neighbourhoods - anti-social behaviour (tenants and shared owners) |
|
|
NM01 (1) - Number of anti-social behaviour cases opened per 1,000 homes. |
35.7 |
|
NM01 (2) - Number of anti-social behaviour cases that involve hate incidents opened per 1,000 homes. |
0.4 |
|
RP01 - Proportion of homes that do not meet the Decent Homes Standard. |
0.6% |
|
RP02 (1) - Proportion of non-emergency responsive repairs completed within the landlord’s target timescale. |
84.1% |
|
RP02 (2) - Proportion of emergency responsive repairs completed within the landlord’s target timescale. |
97.4% |
|
Complaints (tenants only) |
|
|
CH01 (1) - Number of stage one complaints received per 1,000 homes. |
68.2 per 1,000 homes |
|
CH01 (2) - Number of stage two complaints received per 1,000 homes. |
7.8 per 1,000 homes |
|
CH02 (1) - Proportion of stage one complaints responded to within the Housing Ombudsman’s Complaint Handling Code timescales. |
82.1% |
|
CH02 (2) - Proportion of stage two complaints responded to within the Housing Ombudsman’s Complaint Handling Code timescales. |
62.5% |
Thank you for reading
We hope this information was useful.
If you have any questions or feedback, click here to contact us.
